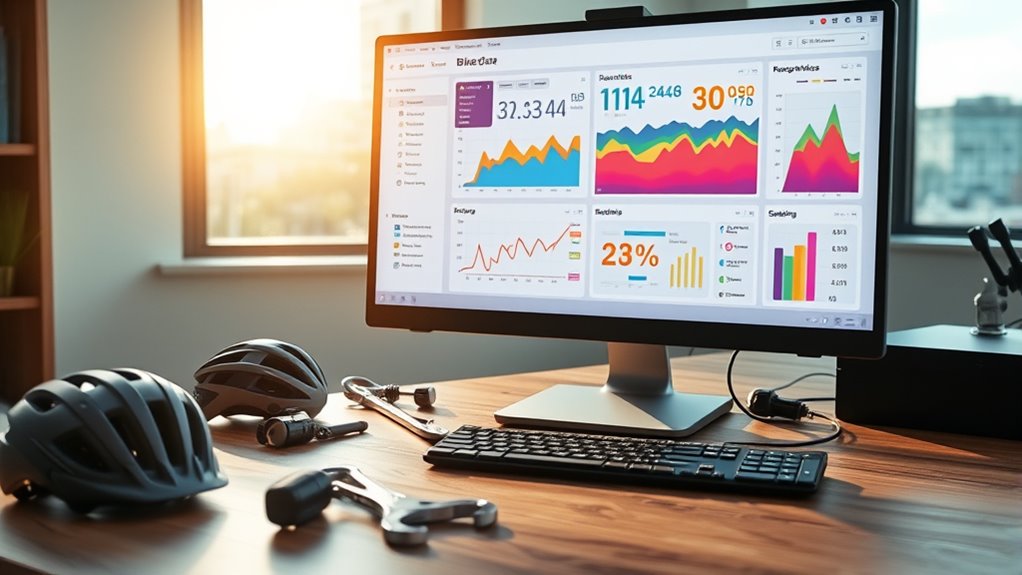

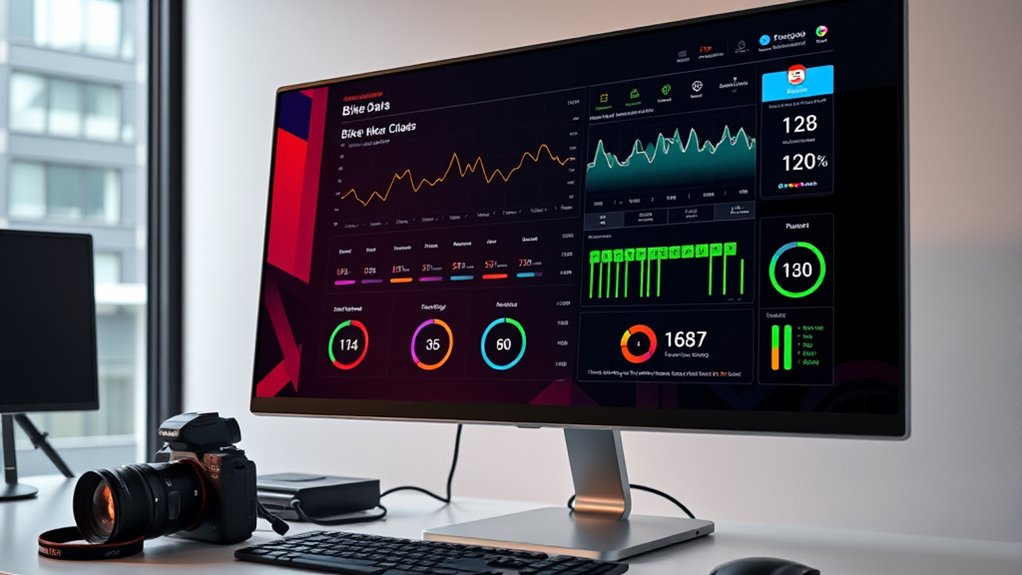
To build a bike data dashboard, start by integrating data from your cycling apps or bike computers, capturing metrics like speed, distance, elevation, and maintenance info. Use graphs and charts such as line and bar graphs to visualize trends and compare performance across rides. Incorporate interactive features like goal setting, alerts, and filters to monitor progress and maintenance needs. Continuing will help you discover how to optimize your cycling experience and maintain your bike effectively.
Key Takeaways
- Identify essential cycling metrics like speed, distance, elevation, and cadence for visualization and analysis.
- Integrate data sources from cycling apps or bike computers for real-time tracking.
- Use graphs and charts such as line and bar graphs to clearly display performance trends and comparisons.
- Incorporate interactive features like goal setting, alerts, and filters to enhance user engagement and insights.
- Design the dashboard to support maintenance reminders, route planning, and performance optimization for safer, more efficient rides.
Creating a bike data dashboard allows you to visualize and analyze key metrics that can improve your cycling performance and maintenance routines. By tracking data such as speed, distance, elevation, and cadence, you gain insights into how you ride and where you can make improvements. With this information at your fingertips, you can plan better cycling routes that challenge you appropriately and help you reach your fitness goals. A well-designed dashboard makes it easier to identify patterns in your riding habits, so you can adjust your training or modify your routes for more efficient workouts. This process not only enhances your performance but also prolongs the lifespan of your bike by keeping you aware of critical maintenance needs.
A bike data dashboard helps improve performance and prolong bike life through insightful metrics and maintenance tracking.
When building your dashboard, start by integrating data from your cycling apps or bike computers. These devices collect real-time information about your rides, helping you understand how different routes or terrains impact your bike’s performance. For example, if you notice frequent drops in speed on certain segments, you can analyze whether those areas require different strategies or bike adjustments. Incorporating bike maintenance data is equally important. Tracking things like tire pressure, chain wear, brake performance, or overall bike health ensures you’re proactive about repairs and adjustments. This reduces the risk of breakdowns during rides and keeps your bike running smoothly, especially on challenging cycling routes. Additionally, understanding the nutrients involved in your diet can help optimize your energy levels for better performance during long rides.
Next, focus on visualizing your data effectively. Use clear graphs and charts to display your cycling metrics over time. Line charts can show trends in speed or elevation, while bar graphs can compare performance across different routes or days. Incorporate filters to isolate specific rides, routes, or bike maintenance issues, making it easier to pinpoint areas for improvement. By doing so, you’ll quickly see how certain routes influence your performance or how bike maintenance factors correlate with ride quality. This clarity allows you to make informed decisions, whether it’s choosing a new route with better terrain or scheduling maintenance to prevent issues before they arise.
Finally, make your dashboard interactive. Adding features like goal tracking or alerts for maintenance milestones keeps you motivated and proactive. For example, setting a target average speed or distance can push you to improve, while reminders to check tire pressure after a certain number of rides keep your bike in top shape. By continuously refining your dashboard and including data from various cycling routes, you create a thorough tool that supports both your performance and your bike’s longevity. This holistic approach ensures that every ride is optimized, safe, and enjoyable, helping you become a more efficient cyclist while maintaining your bike’s health.
Frequently Asked Questions
What Tools Are Best for Real-Time Bike Data Visualization?
You should consider tools like Grafana or Power BI for real-time bike data visualization because they support sensor integration and prioritize data accuracy. These platforms allow you to connect various sensors, ensuring your data flows seamlessly and remains reliable. With customizable dashboards and live updates, you’ll get instant insights into bike performance and rider behavior, helping you make informed decisions quickly and effectively.
How Can I Ensure Data Privacy in My Dashboard?
It’s like catching a coincidental breeze—your dashboard can guarantee data privacy by implementing strong user privacy measures and data security protocols. You should encrypt sensitive data, use secure authentication methods, and limit access to authorized users. Regularly update your security measures, monitor for vulnerabilities, and anonymize user data when possible. By staying proactive, you protect user privacy and maintain trust, just like catching the perfect breeze on a ride.
What Are Common Challenges in Integrating Bike Sensor Data?
You might face challenges like sensor accuracy issues and data synchronization when integrating bike sensor data. Ensuring sensors are properly calibrated helps improve accuracy, so you get reliable readings. Additionally, syncing data from multiple sensors in real-time can be tricky, but using compatible devices and robust data management systems can help. Address these challenges early to create a seamless, insightful bike data dashboard that provides precise and timely information.
How Can I Customize Alerts for Specific Bike Metrics?
Think of your bike’s data like a musical playlist. You can set custom alerts for specific metrics by adjusting your bike threshold notifications and alert customization settings. For example, if your tire pressure drops below a certain point, you’ll get an instant alert. To do this, explore your dashboard’s settings, select the metric, and define the thresholds. This way, you stay in tune and prevent surprises during your ride.
What Are Cost-Effective Options for Small Bike Shops?
You can save costs with small bike shops by choosing affordable maintenance options like regular tune-ups and using cost-effective parts. To boost customer engagement, consider offering loyalty programs or workshops. Use data insights to identify popular services and optimize inventory. Combining affordable maintenance with active customer engagement helps you build loyalty without overspending, ensuring your shop stays competitive and attracts repeat clients.
Conclusion
Creating a bike data dashboard empowers you to make smarter riding decisions and track your progress effortlessly. Some might think it’s too complex or time-consuming, but with simple tools and clear visuals, you’ll find it straightforward and rewarding. Don’t let the initial setup intimidate you—once it’s running, you’ll enjoy real-time insights that enhance your cycling experience. Start today, and see how data can truly elevate your rides without overwhelming you.