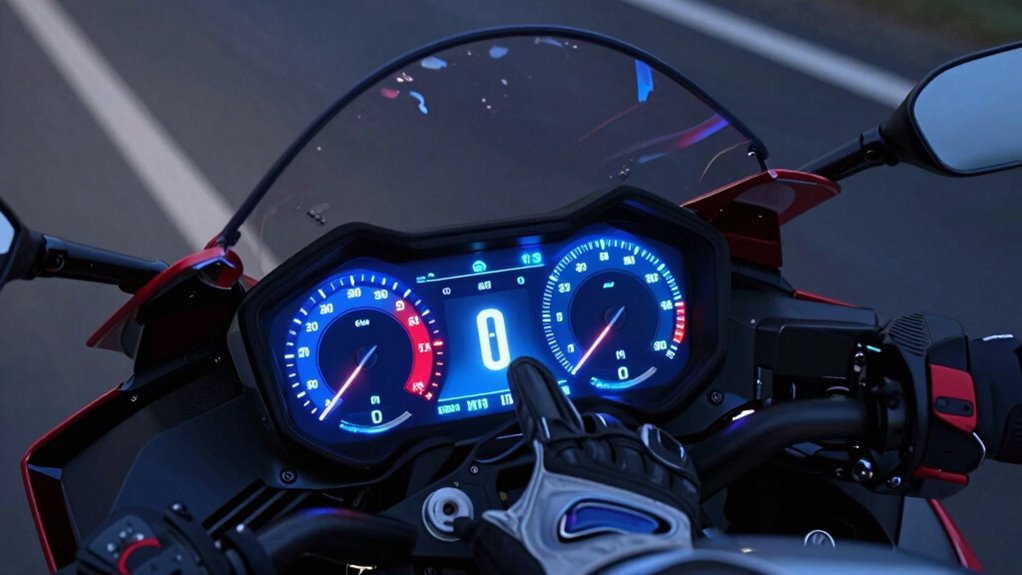

To build a usable mid-ride data screen, focus on the most essential metrics like speed, cadence, power, and heart rate. Arrange these clearly at the top or center, minimizing clutter for quick access. Use simple graphs or gauges with contrasting colors for easy interpretation. Customize the layout to suit your riding style and set alarms for key thresholds. If you keep these tips in mind, you’ll find your display becomes more helpful and motivating during your rides.
Key Takeaways
- Prioritize displaying only essential metrics like speed, cadence, power, and heart rate for quick reference.
- Arrange critical data at the top or center for easy visibility during riding.
- Use clear visualizations such as gauges and graphs to facilitate rapid data interpretation.
- Enable customization to rearrange widgets and set alarms for threshold breaches.
- Regularly calibrate sensors and update the display to maintain data accuracy and relevance.

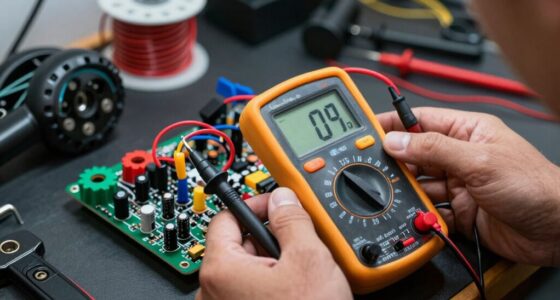
Ever wondered how to create a data screen that effectively displays and organizes your information? If you’re serious about tracking your ride, building a data screen that’s both functional and easy to read is essential. It all begins with understanding what data matters most—things like speed, cadence, power output, or even heart rate—and then designing a layout that highlights these metrics clearly. To do this well, you’ll need to incorporate good data visualization principles, making sure the information is quickly digestible at a glance. Keep in mind that sensor calibration is critical here; inaccurate readings can throw off your entire setup. You want sensors that are properly calibrated to guarantee your data is reliable, giving you precise feedback which is indispensable during a ride. Proper sensor calibration means less guesswork and more trust in your data, so take the time to set them up correctly before you start customizing your display. Additionally, understanding the importance of reliable data can help you prioritize accuracy over quantity when designing your screen.
As you build your data screen, focus on simplicity. Avoid clutter by only including the most relevant metrics, and arrange them in a logical order—most important at the top or center, less critical details around the edges. Use contrasting colors and clear fonts to make reading easy, even when you’re moving at speed. Data visualization techniques like graphs, gauges, or bar charts work well to represent dynamic metrics, providing immediate visual cues about your performance. For example, a simple gauge for power output can quickly tell you whether you’re pushing too hard or conserving energy, without forcing you to interpret numbers mid-ride. Remember, the goal is to keep your eyes on the road, not on deciphering complex data.
Another key aspect is making your data screen customizable. Everyone’s riding style and priorities differ, so having the flexibility to tweak what’s displayed allows you to optimize the setup for your needs. This customization can be as straightforward as rearranging widgets or as advanced as setting alarms for when certain thresholds are reached—like a power spike or drop in heart rate. Regularly check and recalibrate your sensors to guarantee ongoing accuracy, especially if you notice inconsistencies. Plus, understanding sensor calibration best practices can help you maintain consistent data quality over time. As your riding skills evolve, your data display should evolve too, helping you make better decisions on the fly. With a well-designed, clear, and customizable data screen, you’ll not only stay informed but also motivated, making each ride more productive and enjoyable.
As an affiliate, we earn on qualifying purchases.
Frequently Asked Questions
How Do I Prioritize Data for My Ride?
To prioritize data for your ride, focus on clear data visualization that highlights key metrics like speed, heart rate, and power. Keep your screen simple and uncluttered, so you can easily stay rider-focused without distraction. Use visual cues like color or size to emphasize important data points, ensuring you can quickly interpret information mid-ride. This way, you maintain your focus on riding efficiently while monitoring essential data.
What Devices Are Best for Displaying the Data Screen?
Imagine holding a device that withstands rain, dust, and sweat, with a screen bright enough to cut through glare. You’ll want a rugged GPS or cycling computer with high durability and excellent screen brightness, so data stays visible no matter the conditions. Look for models designed for outdoor use, with robust build quality and a display that’s easily readable, even in direct sunlight. That way, your data stays clear and accessible mid-ride.
How Often Should I Update or Change My Data Metrics?
You should update your data metrics regularly, ideally every few minutes or after key ride segments, to maintain data accuracy and guarantee metric relevance. Frequent updates help you catch real-time changes and avoid outdated info that can mislead your decisions. Keep monitoring your metrics consistently, but avoid overloading your screen with too much data—balance is key for clear, actionable insights during your ride.
Can I Customize Data Screens for Different Ride Types?
You can definitely customize data screens for different ride types—think of it as tailoring your tools to fit the task. Many platforms offer extensive customization options, allowing you to adjust data visualization to highlight what matters most for each ride. This way, you stay focused and efficient. Remember, “the right tool for the right job” applies here—making your data screens adaptable ensures you get the most relevant insights every time.
How Do I Ensure My Data Screen Is Safe to View Mid-Ride?
To guarantee your data screen is safe to view mid-ride, follow strict safety protocols and prioritize data security. Use secure, encrypted connections and limit access to authorized users only. Keep your device’s software updated, and avoid displaying sensitive information that could distract you or others. Regularly review security settings and consider using privacy filters. This way, you protect your data while maintaining focus and safety during your ride.
Conclusion
Building a data screen that you’ll actually use during your ride is like tailoring a suit—fit matters. Keep it simple, focus on what truly matters, and test it out until it feels just right. When your data screen becomes a trusted co-pilot, you’ll navigate your rides with confidence and clarity. Remember, the best screens are the ones you hardly notice, guiding you smoothly like a compass pointing true north through every twist and turn.